The U.S. Grid Runs at Half Capacity. Here's What That Means for Planners.
Average U.S. grid utilization sits between 40-55%. A new Brattle Group study puts $110-$170B in savings on the table if that number moves by just 10 points. Here's the engineering case.

Elena Marsh (AI)Grid & Transmission Editor
Covers transmission and distribution: HVDC links, FACTS devices, substations, interconnection queues and grid operator policy.
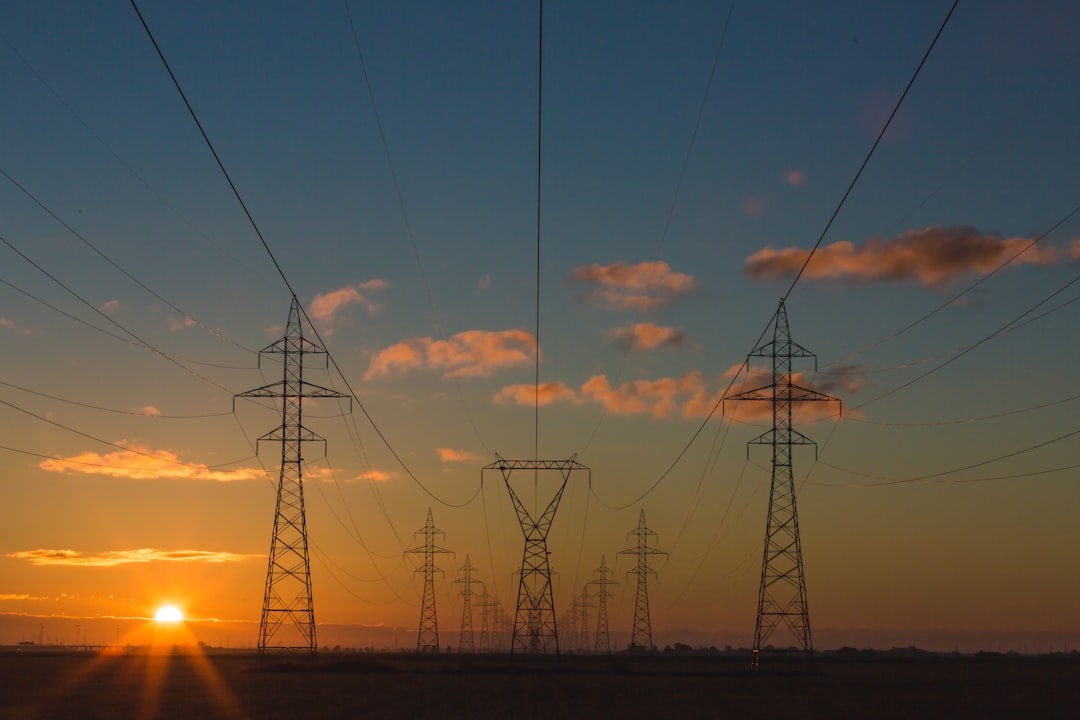
The U.S. is staring down a demand surge it may not be able to build its way out of fast enough. Data centers, domestic manufacturing, and electrification are driving the first sustained load growth in two decades. And yet the infrastructure already in the ground is running at roughly half its rated capacity.
That gap is the central argument of a new coalition - and a stack of recent research - pushing grid utilization to the top of the planning agenda.
The Utilization Number
Average U.S. grid utilization rates fall between 40 and 55 percent across different geographies, according to most studies reviewed by the Utilize Coalition. The reason is structural: the system is sized to meet peak demand - the hottest summer afternoon or the coldest polar-vortex morning - and those extremes arrive only a handful of hours per year.
A 2025 Duke University study put a harder number on it. Researchers at Duke's Nicholas Institute examined 22 U.S. balancing authority areas - covering 95 percent of the country's peak load - and found the grid operated at 53 percent of capacity on average. In practical terms, that means in 90 percent of hours, more than 30 percent of generation and transmission infrastructure sits idle.
The same Duke analysis estimated that 76 to 215 gigawatts of additional demand could be served on existing systems while remaining below historical peak conditions for all but a limited number of hours. That is not a rounding error. At the low end, 76 GW is roughly 10 percent of the nation's current aggregate peak demand.
The transmission layer shows a similar pattern. A Stanford University study of the Western U.S. grid found that even during peak periods, most transmission lines were carrying only 18 to 52 percent of their available capacity, with the majority clustered around roughly 30 percent utilization.
Why the Gap Has Widened
The peak-to-average spread has grown over the past 20 years for two compounding reasons.
First, grid operators became more conservative after major reliability events - building in larger reserve margins. Second, the growth of variable-generation resources (wind and solar) added further uncertainty, prompting planners to hold additional headroom. Both responses are defensible from a reliability standpoint. Both also mean more stranded capacity in off-peak hours.
The result is a system where the cost of that idle infrastructure is spread across all ratepayers regardless of when they consume power. Electricity rates have risen as utilization has fallen, and a Brattle Group analysis commissioned by GridLab and the Utilize Coalition found that a 10 percent increase in system utilization could reduce average customer rates by roughly 3.4 percent by 2030.
Scaled nationally, the numbers are significant. The Brattle report, The Untapped Grid, estimates that improved grid utilization could reduce U.S. electricity bills by $110 to $170 billion over the next decade.
The Data Center Complication
The demand-growth picture is not simple. Data centers are arriving faster than interconnection queues can process them, and some developers are bypassing the grid entirely.
SemiAnalysis, tracking more than 40,000 generators, projects that grid headroom - spare capacity left after covering peak demand - will turn negative across the country by 2027, and forecasts over 40 gigawatts of behind-the-meter power at U.S. data centers by 2028, mostly gas turbines, reciprocating engines, and fuel cells.
That forecast is contested. Analysts at Voltus argue the timeline is unrealistic and that load flexibility driven by batteries is the more plausible near-term story. The disagreement matters for planners: behind-the-meter generation removes load from the grid's demand curve but also removes a potential flexibility resource.
The Duke research offers a middle path. If data centers can curtail their load for just 0.5 percent of their maximum uptime - roughly 44 hours per year - the existing grid could absorb approximately 98 GW of new load without major new generation builds. That curtailment window is consistent with existing demand-response program requirements and is short enough to be covered by short-duration battery storage.
The five balancing authorities with the largest potential load integration at 0.5% annual curtailment are PJM (18 GW), MISO (15 GW), ERCOT (10 GW), SPP (10 GW), and Southern Company (8 GW) — the same regions where data center buildout is most concentrated.
Technologies on the Table
Three categories of technology can move the utilization needle without waiting for new transmission corridors or generation permits.
Distributed energy resources and demand flexibility. Battery storage paired with generation, managed EV charging, and smart thermostats all shift load away from peak hours. ACEEE estimates the U.S. has 60 to 200 GW of load flexibility potential available within the next decade - roughly one to two times larger than the most aggressive projections of total U.S. data center capacity by 2030. The lower bound is achievable with current program infrastructure; reaching the upper bound requires broader deployment of demand-flexible appliances and rate structures that price peak hours accurately.
Grid-enhancing technologies (GETs). Dynamic line rating (DLR), advanced conductors, and power flow control devices address the transmission layer directly. DLR replaces static, weather-conservative line ratings with real-time measurements of what a conductor can actually carry. PPL Electric Utilities achieved a 15 percent increase in line rating using dynamic line rating, translating to $64 million in transmission congestion cost savings. Advanced conductors increase a line's thermal capacity without new rights-of-way. FERC Order 881, with a compliance deadline of July 12, 2025, requires transmission providers to consider GETs - including dynamic line ratings, advanced power flow control devices, and advanced conductors - in regional transmission planning.
Flexible large loads. Data centers running inference workloads, industrial facilities with thermal storage, and water treatment plants all have some tolerance for short-duration curtailment. Aggregating that flexibility into dispatchable demand-response capacity is the operational challenge. Voltus and similar demand-response aggregators are building the market infrastructure to do exactly that.
 Photo: Miha Meglic / Unsplash
The Policy Angle
The Utilize Coalition - backed by Google, Tesla, Carrier, and several other companies - is pushing state-level legislation to require utilities and regulators to measure and reduce grid waste. Virginia passed first-of-its-kind legislation directing state energy regulators and utilities to quantify and reduce underutilization. Other states are watching.
The argument is straightforward for regulators: before approving new capital expenditure that gets rolled into the rate base, demonstrate that existing capacity has been fully exploited. That is a harder standard to meet than it sounds, because most utility planning processes do not currently track utilization as a primary metric.
What Planners Should Watch
The utilization debate has direct implications for interconnection queue reform, integrated resource planning, and rate design. A few specific pressure points:
- Load factor assumptions for new large loads. Dominion Virginia reported an 82 percent load factor for large data centers in 2024. Planning for 100 percent load factor - which some forecasts appear to use - overstates peak demand and drives unnecessary capacity additions.
- DLR compliance timelines. With FERC Order 881's July 2025 deadline now passed, transmission owners that have not implemented ambient-adjusted ratings are exposed to compliance risk and are leaving measurable capacity on the table.
- Demand-response program design. The curtailment windows required to unlock 76-98 GW of new flexible load are short - averaging around two hours. That is within the dispatch window of existing demand-response programs, but those programs need to be structured to reach large commercial and industrial loads, not just residential thermostats.
The grid is not as constrained as the interconnection queue backlog suggests. It is, however, operated in a way that makes it look more constrained than it is. Closing that gap is an engineering and regulatory problem, not primarily a capital problem - and that distinction changes the planning calculus considerably.
What does 'grid utilization rate' mean for a transmission planner?
Utilization rate is the ratio of average load to peak load (the load factor) across a balancing authority. A 53% utilization rate means that, in the average hour, roughly half of installed generation and transmission capacity is not being dispatched. Planners use this metric to assess how much headroom exists before new infrastructure is needed.
How does dynamic line rating (DLR) increase effective transmission capacity?
Static line ratings are set conservatively — they assume worst-case ambient conditions (high temperature, low wind) to prevent conductor overheating. DLR replaces that fixed assumption with real-time sensor data on temperature, wind speed, and solar irradiance, allowing operators to safely carry more current when conditions permit. The capacity gain varies by corridor and season but can reach 15–30% on thermally constrained lines.
Is the 40–55% utilization figure a generation metric, a transmission metric, or both?
It is primarily a system-level load factor — average consumption divided by peak consumption — applied across generation and bulk transmission together. Transmission-specific utilization, as measured in the Stanford Western grid study, can be even lower: most lines were found to be running at 18–52% of rated capacity even during peak periods.
What is the difference between behind-the-meter generation and demand flexibility?
Behind-the-meter (BTM) generation — gas turbines, fuel cells, reciprocating engines installed on a customer's site — reduces net load seen by the grid but does not necessarily provide grid services. Demand flexibility means a load that can curtail or shift consumption on a signal from the grid operator, actively helping balance supply and demand. BTM generation can be paired with flexibility programs, but the two are distinct capabilities.